One of the things that makes ServiceNow such a powerful platform is that it has been enabled out of the box with very powerful tools for you to use to understand what is happening on the platform. If you want to know where you stand in terms of how quickly your agents are able to close cases and/or how the team is performing, you have those tools at the ready. If you are looking to understand the basics of reporting in ServiceNow, you’ve come to the right place. In this blog, we will explore the fundamentals of reporting. Let’s get started!
What is Reporting?
Reporting in the ServiceNow platform allows users to share data, information, and insights with internal team members and leadership to help them better understand the organization’s progress and performance. It provides companies/organizations with the ability to make better decisions and keep track of performance over time. Reports help monitor progress, track trends, compare results, and identify opportunities. It also helps organizations make more informed decisions by providing comprehensive views of operations and performance. Reports can be used to identify areas of improvement and provide evidence of success. Productive reporting helps organizations communicate effectively with stakeholders, improving trust and transparency. It is an essential tool for successful organizations. ServiceNow provides all of these fundamentals within the platform, making it easy to use.
Types of Reports:
One of the many reasons ServiceNow is an industry-leading platform is the reporting module’s library of reports that come with the product out-of-the-box (OOTB). Hundreds of standard reports are available with the click of a button. As this blog is focused on HR Service Delivery, we will review reports related to this application.
Some of the standard reports that can be utilized right away are:
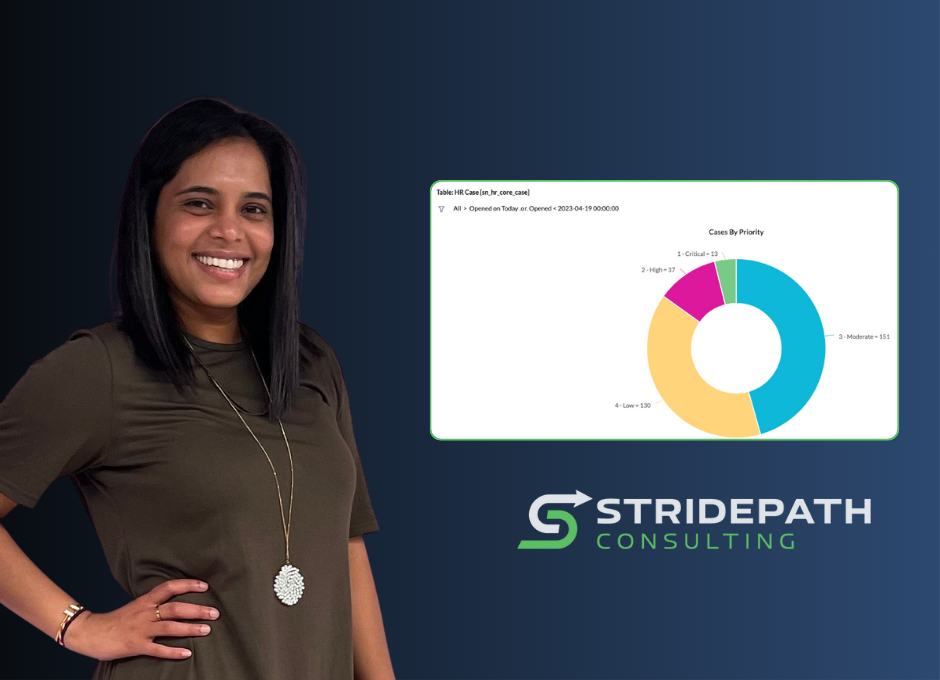
- Cases by Priority – this shows opened cases from all time by priority in a donut chart visualization.
- Active HR Cases – this report is set from the HR Case table and is filtered on active cases in a list view visualization. In this format, it is easy to export the report to Microsoft Excel.
- Unassigned cases – This report is set from the HR Case table that shows a number of cases unassigned to anyone in a single scorecard visualization.
The Rundown
The reporting module in ServiceNow is accessible and user-friendly. The key to building solid reports in ServiceNow is understanding what data you are looking for and where it’s stored, as well as connecting the right table or data source to retrieve the desired details.
For more information or to schedule a call with our team, drop a note to [email protected]!
About the Author: Falguni Patel brings nine years of experience in the HR space, out of which four years have been exclusively in the ServiceNow area. She comes from United Airlines, where she worked in the HRSD space to promote, engage and provide the best user experience within the platform. Falguni enjoys working closely with clients to develop and implement workplace efficiencies. Some of her specializations include Performance Analytics/Reporting, Lifecycle Events, and Safe Workplace.


